


In this edition of The Data Drop, we’ve analysed over 1.4 million GCSE results from schools in the Arbor community. Our focus is on the attainment gap, looking at how results differ between students flagged as Disadvantaged and those who are not.
The Department for Education defines a student as Disadvantaged if they have been eligible for free school meals at any point in the past six years, or if they are currently, or have previously been, looked after by the local authority. In 2023-24, 27% of students in state-funded education fell into this category (source: Improving educational outcomes for Disadvantaged students).
In this blog, we’ll share some headline findings from the data and highlight trends in GCSE results between these two groups.
–
The attainment gap is widening
Looking at the percentage of students achieving at least five GCSEs at grades 9–4 including English and Maths, the gap between Disadvantaged and non-Disadvantaged students has increased every year since 2021.
- 2021: 25.7 percentage points
- 2022: 27.0 percentage points
- 2023: 27.8 percentage points
- 2024: 28.4 percentage points
- 2025: 28.7 percentage points
That’s a rise of just over 3 percentage points in five years, from 25.7 to 28.7.
While results for non-Disadvantaged students have remained broadly stable, Disadvantaged students’ results dipped after 2021, with only a modest recovery in the most recent years. The overall effect has been a steady widening of the gap.
What does this mean for Disadvantaged students’ progression into more academic post-16 and higher education courses, which often set English and Maths GCSEs as entry requirements?
–
–
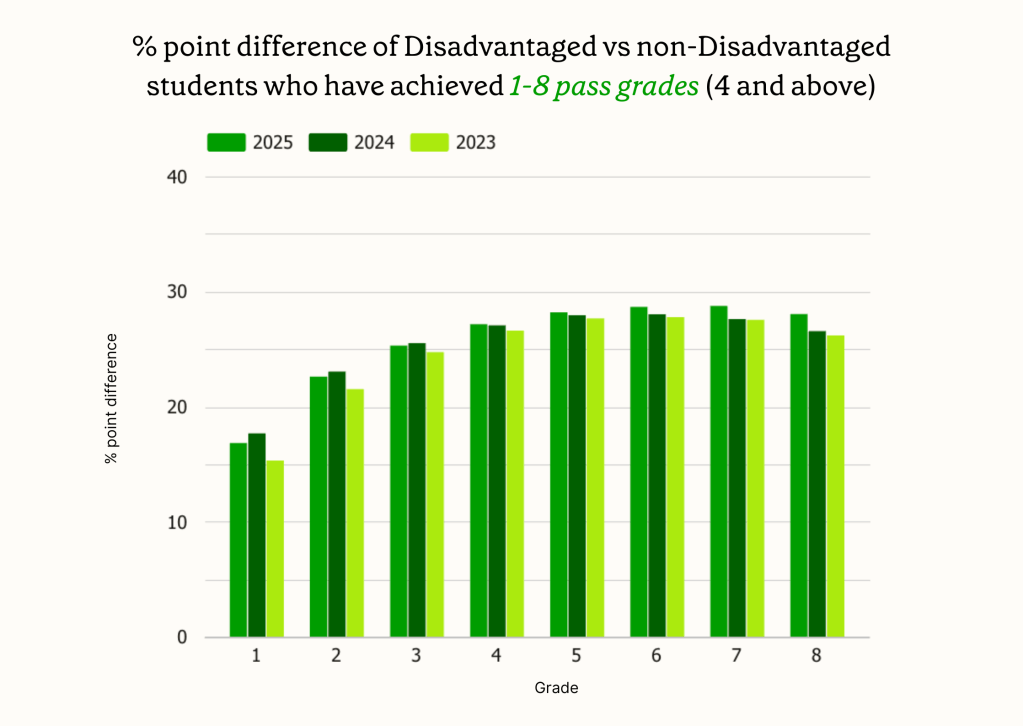
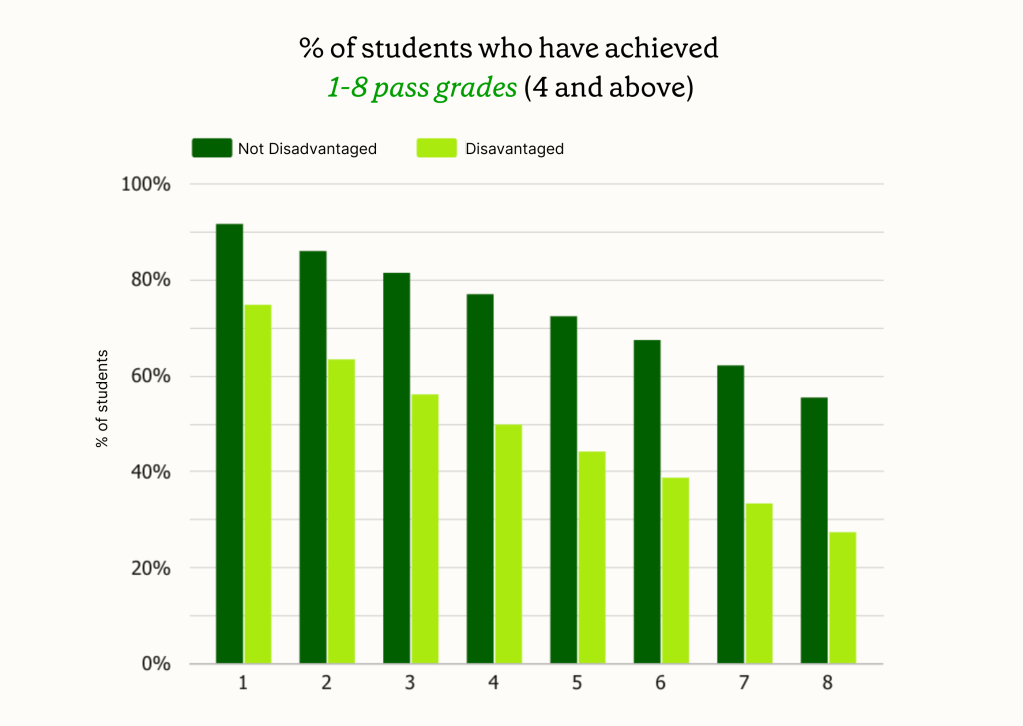
Gaps widen as the number of GCSE passes increase
When we look at the percentage of students achieving at least 1, 2, 3 and up to 8 GCSE passes, a clear pattern emerges. At the lower end, the gap between Disadvantaged and non-Disadvantaged students is noticeable but smaller. As the number of passes rises, the gap becomes much larger.
In 2025, for example:
- At least 1 pass: 16.8 percentage points
- At least 4 passes: 27.2 percentage points
- At least 6 passes: 28.7 percentage points
- At least 8 passes: 28.0 percentage points
This shows that Disadvantaged students are more likely to secure some passes, but much less likely to achieve higher numbers compared to their peers.
The same shape is visible in earlier years too, meaning this is a consistent pattern rather than a one-off.
–
Achieved grade 5 or above in English and Maths
Looking at the percentage of students achieving grade 5 or above in both English and Maths, the gap between Disadvantaged and non-Disadvantaged students is wide and has grown since 2021.
- 2021: 22.8 percentage points
- 2022: 25.6 percentage points
- 2023: 25.3 percentage points
- 2024: 25.8 percentage points
- 2025: 26.0 percentage points
That’s an increase of just over 3 percentage points in five years. Disadvantaged attainment rose slightly in 2022 but has since fallen back, leaving the difference at its widest point in the period.
–
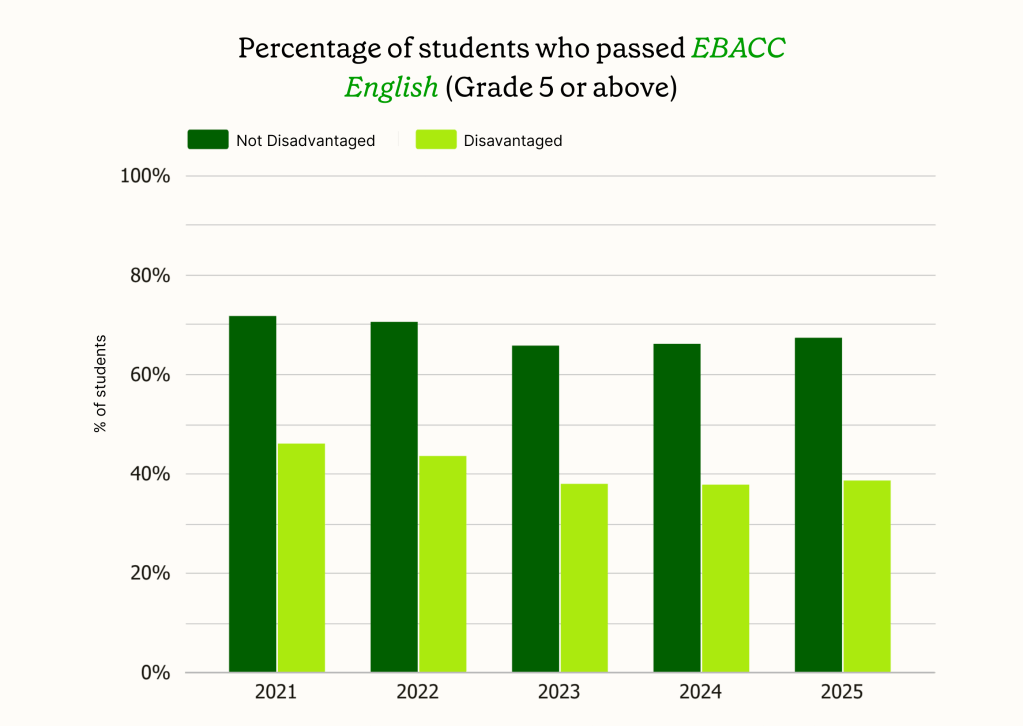
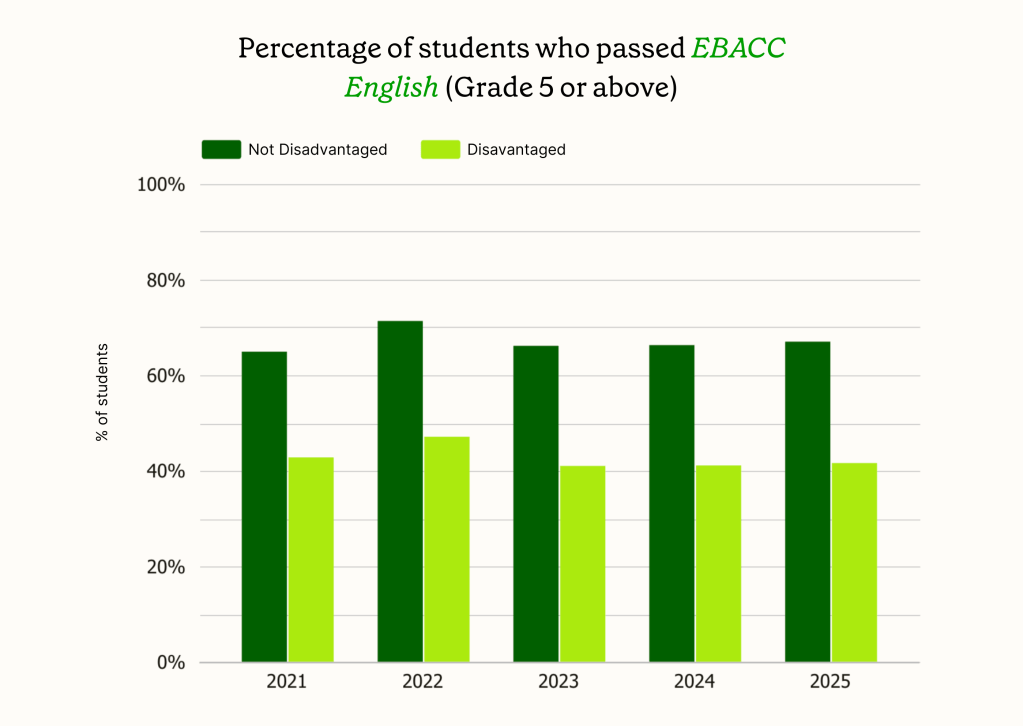
English GCSEs: grade 5 or above
Looking at English GCSEs on their own, the percentage of Disadvantaged students achieving grade 5 or above is consistently lower than their peers, with the gap widening slightly in recent years.
• 2021: 22.1 percentage points
• 2022: 24.2 percentage points
• 2023: 25.1 percentage points
• 2024: 25.2 percentage points
• 2025: 25.4 percentage points
The gap has grown by just over 3 percentage points since 2021. While attainment for non-Disadvantaged students has stayed relatively stable, Disadvantaged students saw a small uplift in 2022 followed by a decline and then a slight recovery, leaving the overall gap wider than before.
–
Maths GCSEs: grade 5 or above
In Maths, the attainment gap is even larger than in English, and it has grown steadily over time.
• 2021: 24.7 percentage points
• 2022: 25.7 percentage points
• 2023: 26.1 percentage points
• 2024: 26.9 percentage points
• 2025: 26.8 percentage points
Disadvantaged students’ attainment has fallen since 2021 and, despite small fluctuations, has not recovered. Non-Disadvantaged students’ results have also dipped slightly, but the gap between the two groups has widened overall.

–
Conclusion
Our dataset shows a consistent picture: Disadvantaged students are less likely to achieve key GCSE benchmarks, and the gaps with their peers have widened in recent years. Whether it’s the proportion achieving five passes at grades 9–4, the number of subjects passed, or achieving grade 5 and above in English and Maths, Disadvantaged students remain at a clear disadvantage.
These trends are similar to what’s been highlighted nationally. The National Audit Office reported that in 2022/23, 25% of Disadvantaged pupils achieved grade 5 or above in English and Maths, compared with 52% of their peers. Reducing this gap remains a key focus for the education sector.
The challenge is not only to understand the reasons behind these persistent differences, but also to consider their impact on students’ future pathways. For example, missing grade 5 in English and Maths can limit access to more academic post-16 and higher education courses, with potential long-term effects on life chances.As the data continues to show, closing the attainment gap remains one of the most pressing challenges in education today.
From everyone at Arbor, we’d like to extend our congratulations to all staff and students on the hard work that has gone into this year’s results. Find all of the articles in The Data Drop here, with insights ranging from clubs and trips analysis through to attendance by demographic.
–
–
Methodology
To compile this data, we’ve looked at students enrolled in Year 11 in English schools during this academic year, using results from qualifications approved by the DfE.
Results counted here include any pass grades, and in some cases a U in English or Science. It’s possible that a small number of students who didn’t achieve any GCSE Exam Awards may be missing, although most are likely to have at least an English entry or a vocational pass. This approach should also reduce the number of students who left before exams began, but those with early awards may still appear.
The figures are based on GCSE results only. As with any early results analysis, the numbers may shift slightly as data is updated. This snapshot reflects the position as of 16:00 on 20 August 2025.
Sources