


Welcome to Arbor’s Data Drop. Our philosophy at Arbor is that staff should have direct, easy access to their data – and be able to do something meaningful with it. Our MIS is built on a world-class data platform, which allows us to deliver things like national-level benchmarking to schools and trusts within seconds, rather than hours or days. And allows schools to make real-time, data-driven decisions.
This series is designed to share insights from our data warehouse (containing the data of c.4000 schools), to shed light on the wider patterns emerging across the education sector.
In this edition of The Data Drop, we’re looking at attendance, specifically for Pupil Premium eligible and SEN students – the data we’re presenting is from 1/09/2022 to 19/05/2023.
Before we look more closely at these categories, it’s worth noting the general trends across Primary and Secondary Schools in this time frame. Overall, attendance is lower in Secondary than in Primary Schools year to date – 90.4% compared to 93.7%. Plus, persistent absenteeism (students with less than 90% attendance) is far higher, with 30.6% of students in Secondary Schools identified as Persistent Absentees, compared with 19.4% in Primary Schools.
–
Pupil Premium eligible attendance
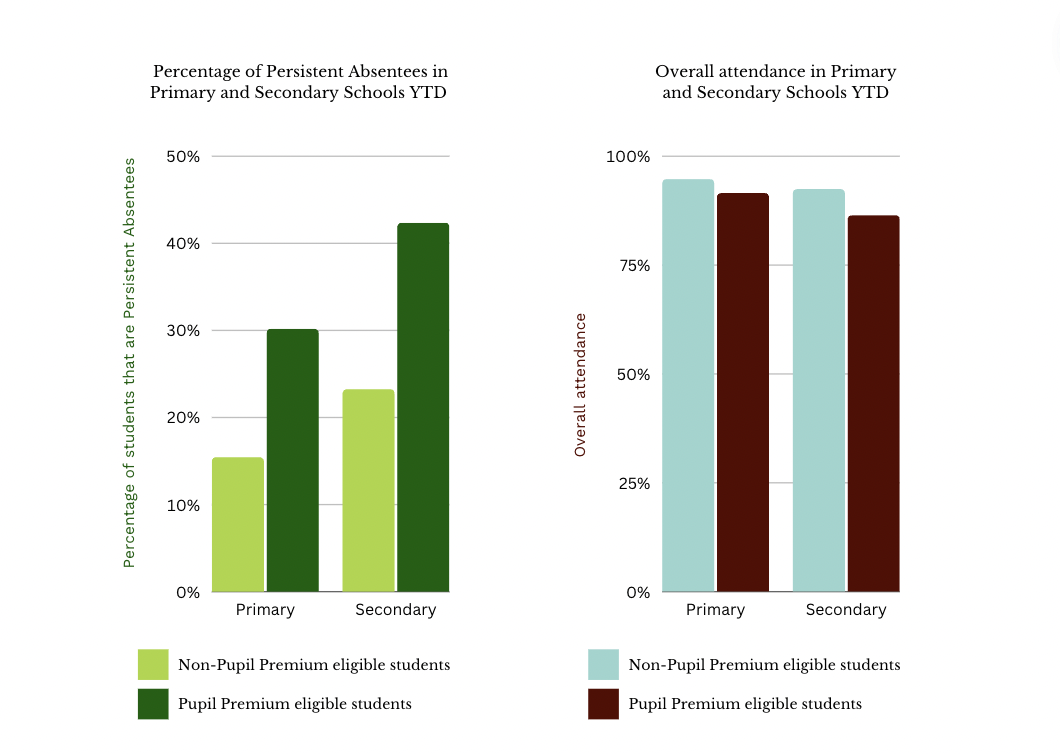
We wanted to take a closer look at how attendance patterns varied when separating out the data for Pupil Premium eligible students. In Primary Schools, the percentage of Pupil Premium eligible students who are persistently absent (30.1%) was nearly double that of those students who were not Pupil Premium eligible (15.4%). A similar trend can be seen in Secondary Schools, with 42.2% of Pupil Premium eligible identified as persistent absentees, compared with 23.3% of non-Pupil Premium eligible students.
Overall attendance was also significantly lower for Pupil Premium eligible students across both phases:
Primary Schools: 91.4% vs. 94.6%
Secondary Schools: 86.3% vs 92.3%
–
SEN attendance
Similar patterns also emerged when looking at the data of SEN vs. non-SEN students across both phases (not including Special Schools). In Primary Schools, 28.1% of SEN students are persistently absent, compared with 17.5% amongst non-SEN students. In Secondary Schools, 40% of SEN students are identified as persistent absentees, compared with 25.9% of non-SEN students. Though the difference is not as stark as with Pupil Premium eligible students, there is still a significant gap
The same can be said about overall attendance of SEN students vs. non-SEN students:
Primary Schools: 91.5% for SEN students vs. 94.2% for non-SEN students
Secondary Schools: 86.1% for SEN students vs 91.7% for non-SEN students

–
Methodology and terminology
Data is taken from 01/09/2022 – 19/05/2023
This data is taken from Arbor’s data warehouse – statistically accurate within 0.01% of the data from the Department of Education.
Present: Percentage of ‘present’ records out of all ‘possible’ records. This conforms to the DfE methodology for calculating attendance in the performance tables. Examples of ‘impossible’ sessions include those where the student is not of compulsory school age or where the school is closed (including for strikes).
Persistent Absenteeism: A student is considered persistently absent if their attendance is under 90%.
At Arbor, we’re on a mission to help schools make the most out of their data. Want to see how your school’s attendance data compares with other schools in the country? Find out more about Arbor’s Live National Benchmarks, built into your school MIS.


Leave a Reply