


As I’m sure you’ve heard, School Pupil Tracker Online (SPTO) will be closing down at the end of this year. If you currently use SPTO, you’ll be looking for something to replace it with the same (if not better!) level of functionality and analysis, so this is a great opportunity to look at how you’re using your current MIS system as a whole. To help you, we’ve written this a short blog explaining how schools & MATs use the integrated assessments module of Arbor’s simple, smart, cloud-based MIS to track, analyse and report on pupil progress.
Let’s start with the basics. Like SPTO, Arbor’s assessments module covers the following:
1. Formative Tracking: In Arbor, teachers can enter marks against curriculum statements and view formative analysis. This helps inform lesson planning and differentiate learning based on students’ understanding of the curriculum. You can either use preset or imported curriculum frameworks, or create your own custom curriculum framework in the system:

Image 1: A teacher marking a formative reading assessment
2. Summative Tracking: You can also access marksheets, enter marks for summative & ad hoc assessments, and view and export analysis for summative, ad hoc and 3rd party standardised assessments (such as PiRA and PUMA tests from RS Assessments by Hodder Education)

Image 2: Grade distribution dashboard analysing a summative assessment
Arbor also has some more in-depth, out-of-the-box analysis tools to help you dig deeper into your assessment data:
3a. Attainment over Time allows you to see how many students are achieving each grade during different assessment periods. The date chosen provides a breakdown of the available grades at that given point in time:

Image 3: Measuring Attainment Over Time
You can also choose to group students by demographic, in order to compare grades. For example, you can compare girls to boys and identify that girls currently require more support in this subject:

Image 4: Comparing students by demographic
3b. Below, At or Above: The Below, At or Above page allows schools to see the percentage of children who are below/at/above their targets for each assessment period:

Image 5: Tracking pupil progress using Below, At or Above, and clicking on a record to retrieve a slideover of students
3c. Analysis at MAT level: Some assessments, like PiRA & PUMA, even push up to Arbor’s Group MIS for dashboard analysis across schools:
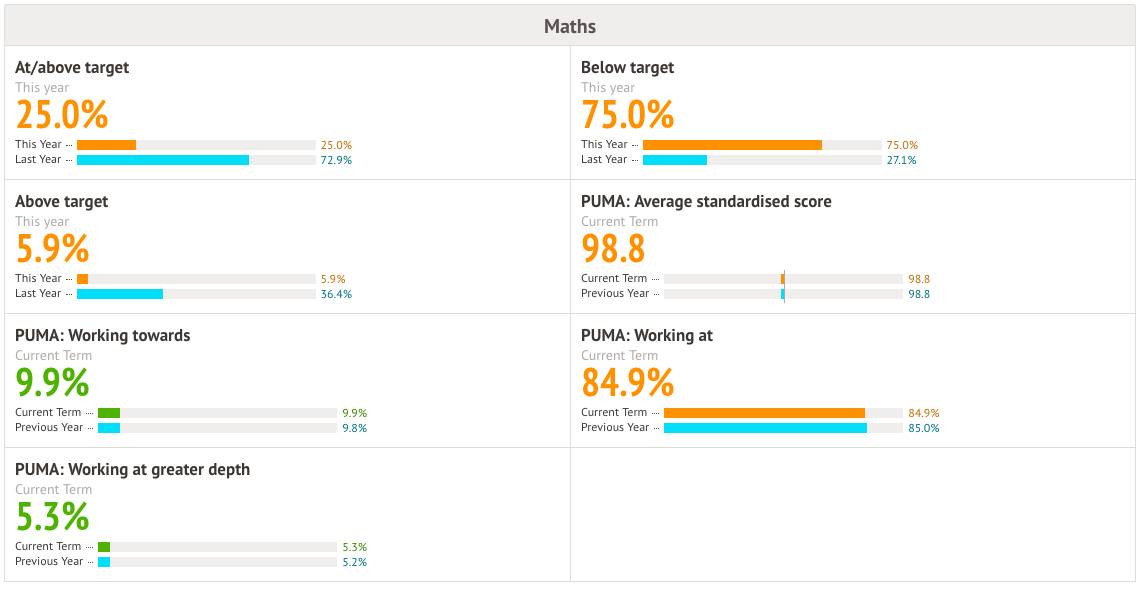
Image 6: A screenshot of aggregated data in Arbor’s Group MIS

Image 7: A plain-text callout explaining your data
4. Most importantly though, the biggest benefit of using assessments in Arbor MIS is that it’s a fully-integrated module that syncs up with all the other data in your MIS system. This means:
- Teachers only have one login to perform all their assessment marking, run their classes, take registers, and perform their other daily tasks
- Our powerful bulk actions can be performed from any table of assessment data, for instance to send a mail merge email directly to your top performing students to congratulate them, or to directly enrol a set of underperforming students in an intervention
- Assessment trends can easily be compared with trends in behaviour, attendance, and other modules both for groups and for individual students, to create a holistic picture of their progress in all areas through the school
Interested in finding out more about how Arbor’s simple, smart, cloud-based MIS could transform the way your school works? Get in touch with us via the contact form on our website or give us a call on 0208 050 1028

