

Looking back at the last academic year, which students took the most trips?
Our graphs below show how many trips each year group or demographic taken per 100 students.
–
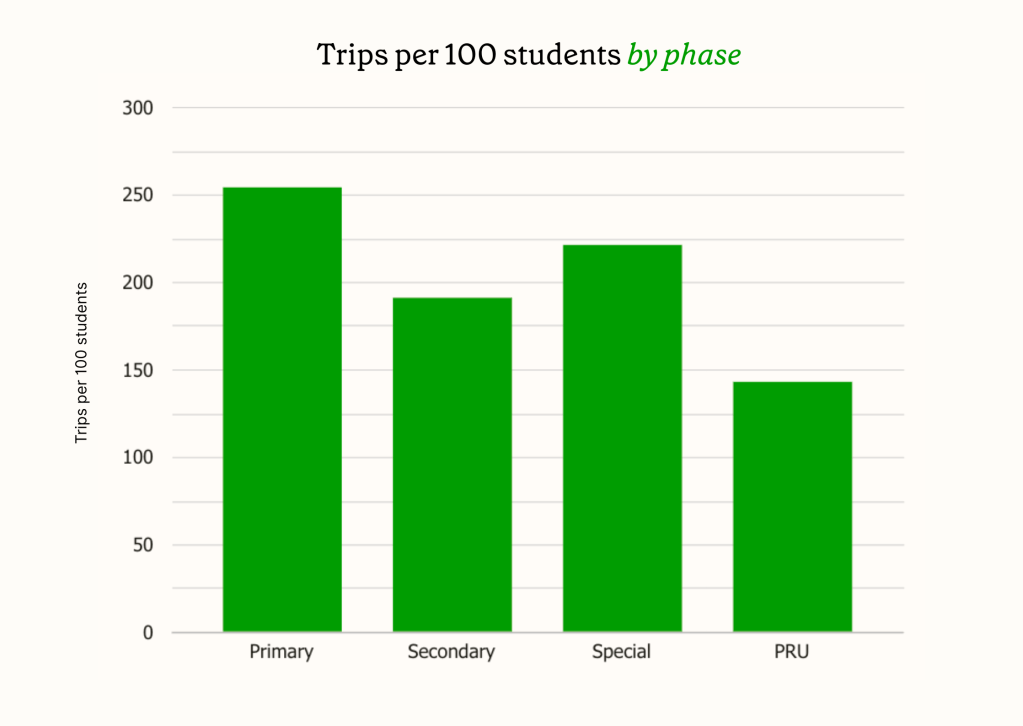
The number of trips in different school phases
Overall, the average primary school student went on 2.5 school trips this year, compared with 1.9 in secondaries, 2.2 in special schools and 1.4 in PRUs.
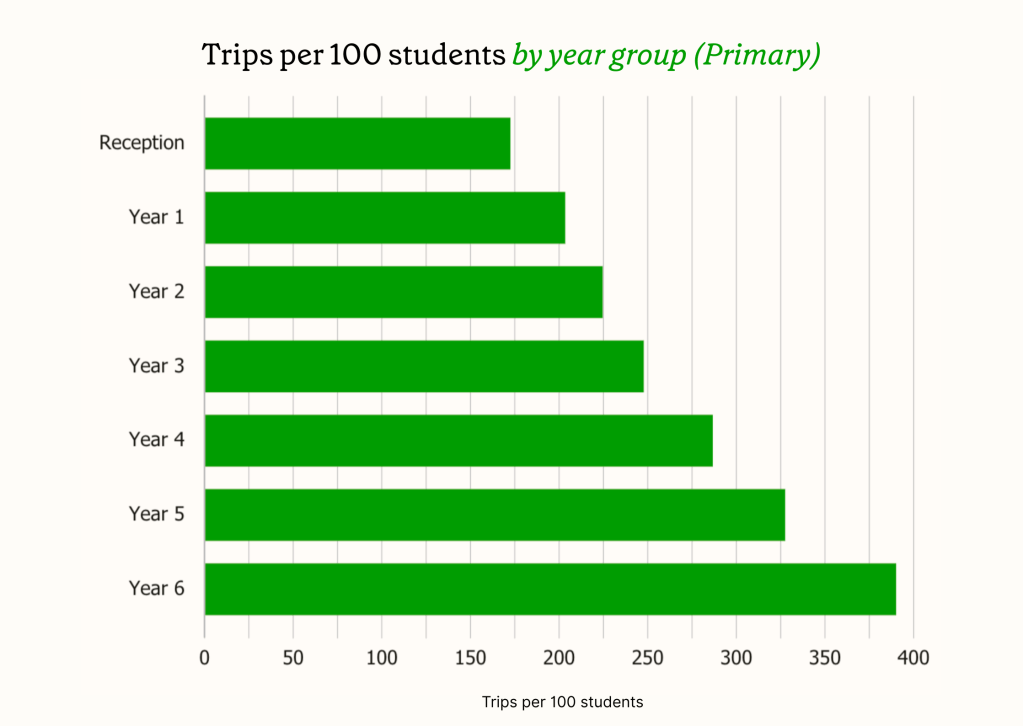
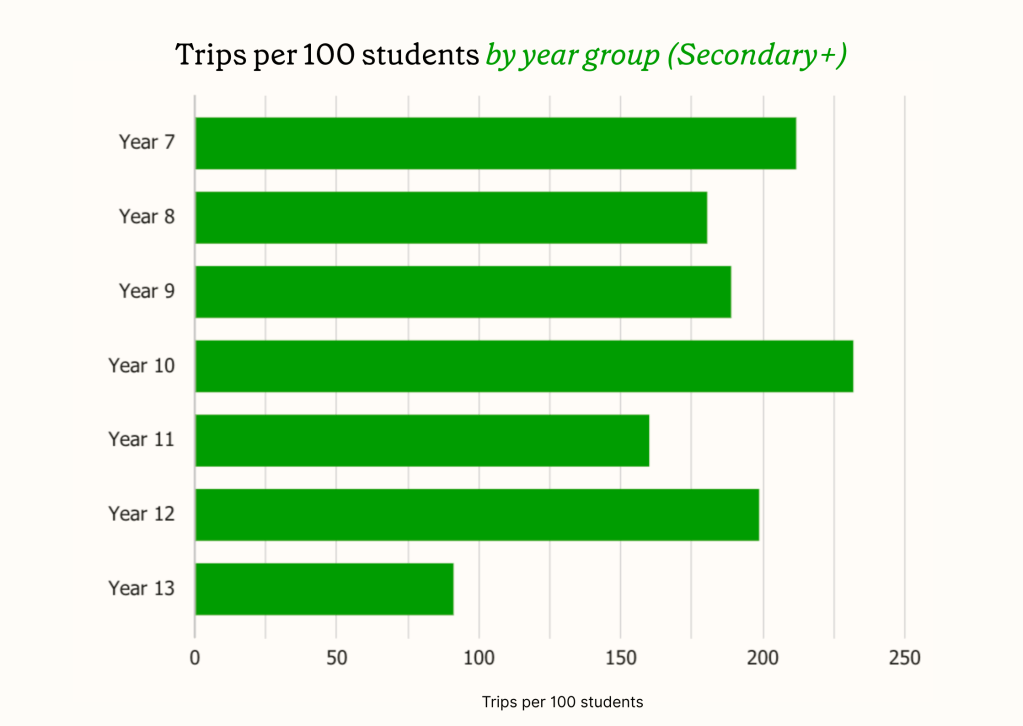
At primary and secondary school level, we’ve broken this down per year group. There is a clear upward trend within primary schools, with Reception children going on the least trips (1.7) and Year 6 children going on the most (3.9). The trend is less clear for secondary and above, with Year 10 students going on the most trips in this phase (2.3), followed by Year 7 students (2.1). Year 13 go on the least trips (0.9).
–
—
Trip attendance across different demographics
Our data shows that disadvantaged, FSM, Pupil Premium, SEN and EAL students are less likely to go on trips when compared with the primary and secondary averages. Of these demographics, primary school EAL students attend the least number of trips (2.2), but secondary school EAL students attend the most number of trips (1.8).

–
Note on methodology
This analysis is based on the data of schools in the Arbor Community (9,900).
We look at the trips a student is a participant of, and use the academic year based on the start date of the trip.
Schools sometimes use the Trips module in Arbor beyond its intended use, meaning that there are likely additional entries of things that aren’t technically ‘trips.’ This may mean our analysis is higher than expected.
We have only included schools in this analysis if they have over 60 trip participants in the last 2 years. This filters out schools who don’t actively use this module.


