


In this edition of The Data Drop, we’ve analysed over 200,000 A-Level results from schools in the Arbor community. Below, you’ll find an in-depth breakdown of results from each subject area.
We’ve grouped qualifications using their Discount Code and Subject Specific Area, following the 16 to 18 qualifications, discount codes and point scores framework. In this context, a discount code is a classification used to group similar qualifications together, so results from different courses in the same subject area can be analysed as a whole. This approach makes it easier to spot trends that might be missed if you only looked at individual course titles.
Understanding these trends helps schools benchmark performance, review curriculum choices and set realistic but ambitious targets for the next cohort.
–
Mathematics and statistics
Entries
Entries for Mathematics and Statistics have fluctuated over the past three years. They rose from 30,773 in 2023 to 36,674 in 2024, before falling back to 33,696 in 2025.
Results
Results in Mathematics and Statistics have stayed steady across 2023 to 2025, even with these shifts in entry numbers. The proportion of A*-A grades has held at around 40% each year.
A*-C pass rates have edged up from 77.4% in 2023 to 78.0% in 2025, despite a small dip in 2024. There’s been a drop in the proportion of students achieving an E grade (from 8.9% down to 7.8%) and a rise in those achieving a B (from 19.5% up to 20.7%), though both saw a brief reversal in 2024.

The subject shows stable outcomes overall, with only minor changes in grade distribution year-on-year.
–
English Language and English Literature (Languages, literature and culture of the British Isles)
Entries
Entries for English Language and Literature increased from 13,089 in 2023 to 15,671 in 2024, before dropping to 13,293 in 2025 — almost back to the 2023 level.
[Chart showing entry numbers 2023–2025 would appear here]
Results
Results in English Language and Literature have remained relatively steady despite these changes in entry numbers. A*-A grades have eased slightly from 18.8% in 2023 to 17.7% in 2025.
A*-C pass rates dipped from 75.4% in 2023 to 73.6% in 2024, before recovering to 74.6% in 2025. B remains the most common grade, at just over 31% each year. D and E grades have seen a small increase over the period.

The subject shows stable outcomes overall, with only minor changes in grade distribution year-on-year.
–
Science
Entries
Entries for Science have varied over the three years, rising from 66,667 in 2023 to 67,928 in 2024, before dropping to 60,752 in 2025.
Results
Despite the decline in entries in 2025, results in Science have shown steady improvement. A*-A grades have risen from 22.9% in 2023 to 24.2% in 2025.
A*-C pass rates have climbed from 68.8% in 2023 to 72.3% in 2025. B is the most common grade, increasing from 23.0% to 24.7% over the same period. E grades have fallen year-on-year, from 12.4% in 2023 to 10.3% in 2025.
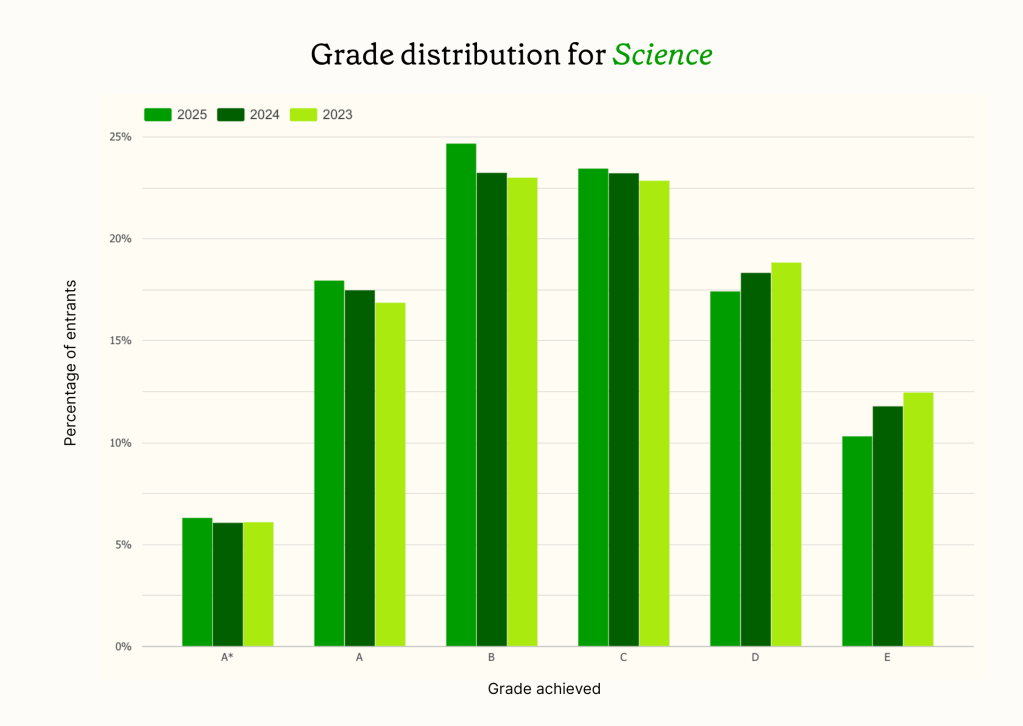
The subject shows stable outcomes overall, with gradual improvement in the proportion of higher grades.
–
Modern Foreign Languages (Other languages, literature and culture)
Entries
Entries for Modern Foreign Languages have stayed fairly consistent, moving from 5,504 in 2023 to 5,725 in 2024, before dipping slightly to 5,220 in 2025.
Results
Results in Modern Foreign Languages have remained strong across the three years. A*-A grades have held close to 38%, with a small peak in 2024.
A*-C pass rates have risen from 82.0% in 2023 to 83.9% in 2025. B is the most common grade, at just over 28% in both 2024 and 2025. E grades have declined overall, from 5.3% in 2023 to 4.2% in 2025.
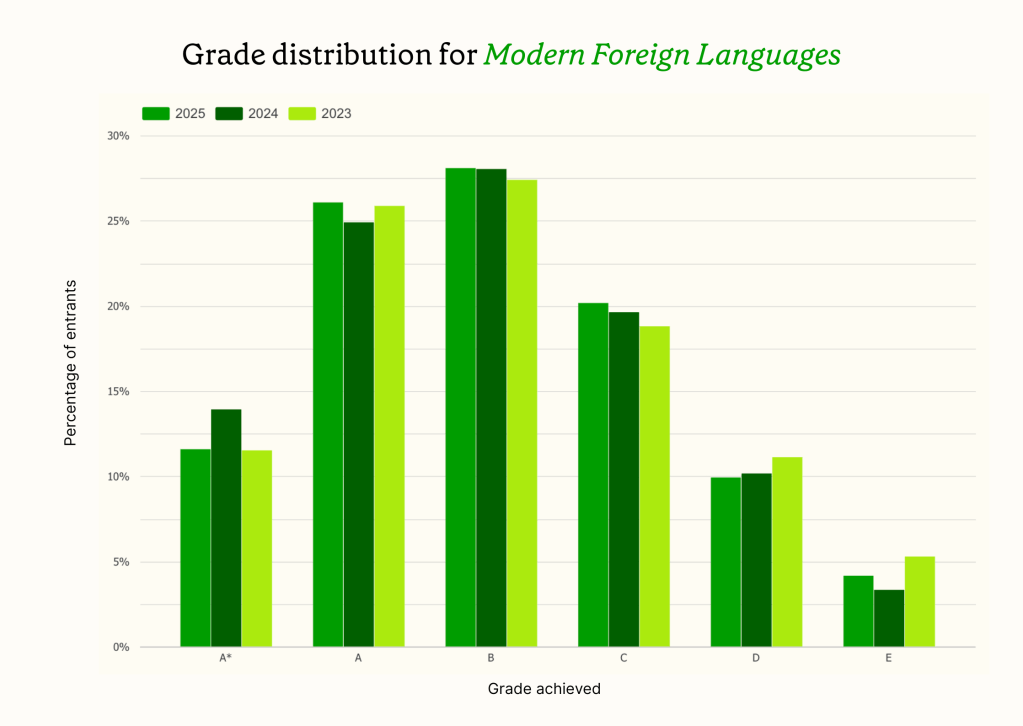
The subject shows stable outcomes overall, with a very high proportion of students achieving a pass.
–
History
Entries
Entries for History have fallen steadily over the three years, from 10,424 in 2023 to 10,352 in 2024, and down further to 8,649 in 2025.
Results
Despite the drop in entries, History results have shown gradual improvement. A*-A grades have risen from 21.6% in 2023 to 22.7% in 2025.
A*-C pass rates have increased from 80.5% to 83.2% over the same period. B remains the most common grade, making up around a third of all results. E grades have dropped from 5.7% in 2023 to 3.8% in 2025.
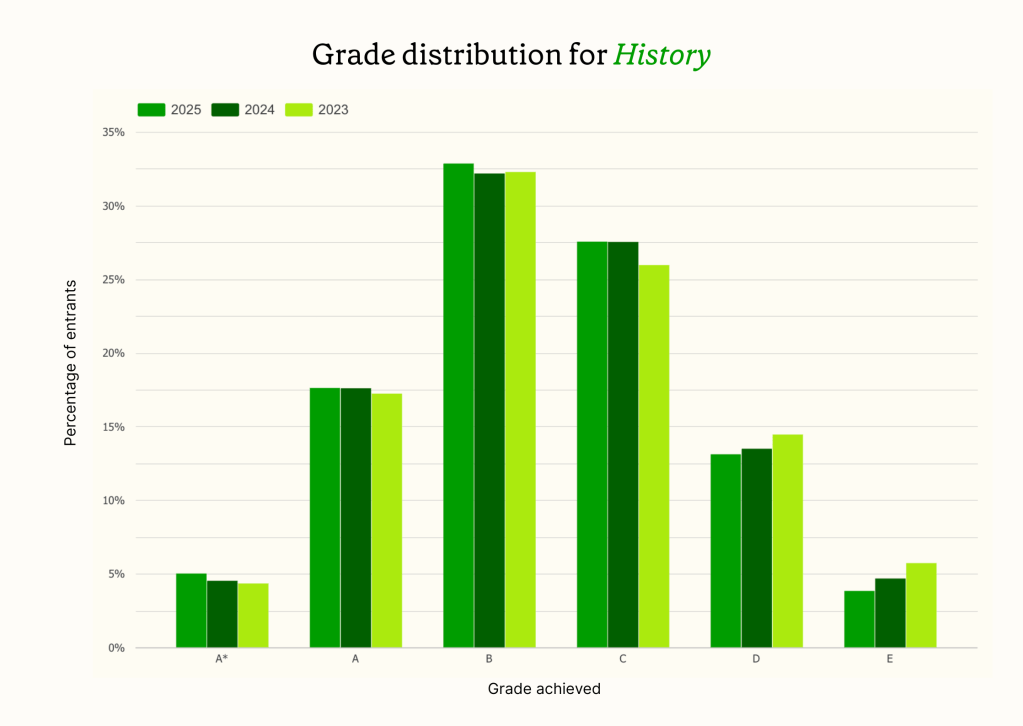
The subject shows stable outcomes overall, with gradual improvement in pass rates and fewer results at the lower end of the scale.
–
Geography
Entries
Entries for Geography rose from 9,066 in 2023 to 9,513 in 2024, before falling sharply to 7,492 in 2025.
Results
Geography results have remained broadly steady over the three years. A*-A grades dipped from 22.3% in 2023 to 21.2% in 2024, before recovering to 21.7% in 2025.
A*-C pass rates have stayed within a narrow range, from 77.2% in 2023 to 78.4% in 2025. B is the most common grade, accounting for around 28–29% of results. E grades rose slightly in 2024 before falling to their lowest point of 5.8% in 2025.

The subject shows stable outcomes overall, with only small year-on-year changes across the grade distribution.
–
Theology and religious studies
Entries
Entries for Theology and Religious Studies have remained fairly steady, moving from 2,871 in 2023 to 3,051 in 2024, before falling slightly to 2,853 in 2025.
Results
Results in Theology and Religious Studies have been consistent year-on-year. A*-A grades have stayed at around 23% each year.
A*-C pass rates have risen slightly from 77.3% in 2023 to 79.5% in 2025. B is the most common grade, increasing from 29.2% in 2023 to 30.6% in 2025. E grades have remained stable at around 6–7%.

The subject shows stable outcomes overall, with only minor changes in grade distribution year-on-year.
–
Sport, leisure and recreation
Entries
Entries for Sport, Leisure and Recreation have declined over the past three years, from 2,659 in 2023 to 2,519 in 2024, and further to 2,317 in 2025.
Results
Results in Sport, Leisure and Recreation have stayed relatively stable despite the fall in entries. A*-A grades have moved between 15.5% and 16.1% over the three years.
A*-C pass rates have risen from 67.0% in 2023 to 70.5% in 2025. B is the most common grade, with a slight increase from 24.6% to 25.3%. E grades have dropped from 11.5% in 2023 to 8.4% in 2025.

The subject shows stable outcomes overall, with a modest improvement in the proportion of higher grades.
–
Performing arts
Entries
Entries for Performing Arts have fallen over the three-year period, from 3,148 in 2023 to 2,819 in 2024, and further to 2,718 in 2025.
Results
Results in Performing Arts have remained positive despite the reduction in entries. A*-A grades rose from 16.3% in 2023 to 20.8% in 2024, before easing slightly to 19.1% in 2025.
A*-C pass rates have stayed high, at 77.4% in 2023 and 78.6% in 2025. B is the most common grade, increasing from 33.4% to 35.3% over the period. E grades have remained low, fluctuating between 3.8% and 4.2%.

The subject shows stable outcomes overall, with strong results maintained alongside falling entry numbers.
–
Crafts, creative arts and design
Entries
Entries for Crafts, Creative Arts and Design have decreased over the period, from 6,417 in 2023 to 6,595 in 2024, then down to 5,785 in 2025.
Results
Results in Crafts, Creative Arts and Design have been consistently strong. A*-A grades have risen from 25.8% in 2023 to 29.0% in 2025.
A*-C pass rates have stayed high, moving from 81.5% in 2023 to 85.0% in 2025. B is the most common grade, holding at around 31%. E grades have declined from 5.1% in 2023 to 3.8% in 2025.

The subject shows stable outcomes overall, with a gradual shift towards higher grades.
–
Sociology and social policy
Entries
Entries for Sociology and Social Policy have declined over the period, from 16,800 in 2023 to 16,123 in 2024, and down further to 14,160 in 2025.
Results
Results in Sociology and Social Policy have been steady overall. A*-A grades have eased from 19.7% in 2023 to 17.6% in 2025.
A*-C pass rates have remained high, moving from 77.6% in 2023 to 78.2% in 2025. B is the most common grade, increasing from 30.0% to 30.8% over the same period. E grades have stayed at 6.1% in both 2023 and 2025, after peaking in 2024.

The subject shows stable outcomes overall, with only small year-on-year changes in grade distribution.
–
Politics
Entries
Entries for Politics have decreased slightly over the three years, from 5,198 in 2023 to 5,264 in 2024, and down to 4,649 in 2025.
Results
Results in Politics have improved overall. A*-A grades have risen from 24.5% in 2023 to 26.6% in 2025.
A*-C pass rates have stayed strong, moving from 72.3% in 2023 to 76.1% in 2025. B is the most common grade, increasing from 28.1% to 30.8% over the same period. E grades have dropped from 6.6% in 2023 to 5.4% in 2025, after peaking in 2024.
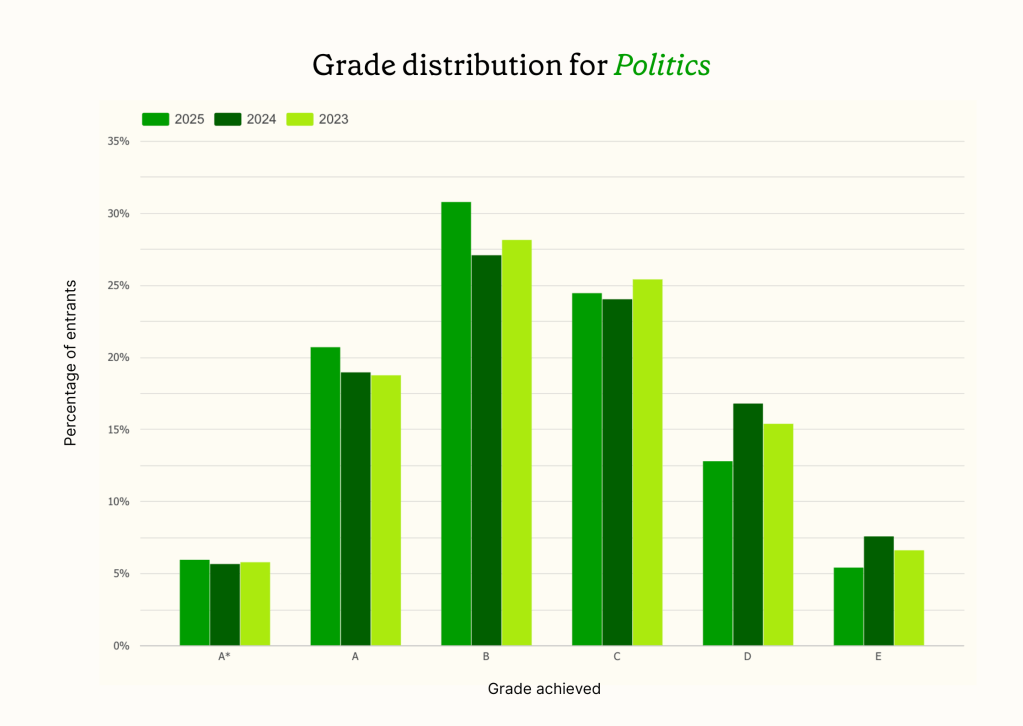
The subject shows stable outcomes overall, with a gradual shift towards higher grades.
–
Law and legal services
Entries
Entries for Law and Legal Services have remained steady, at 2,226 in 2023, 2,252 in 2024, and 2,180 in 2025.
Results
Results in Law and Legal Services show small shifts in grade distribution. A*-A grades have fallen from 16.2% in 2023 to 13.2% in 2025.
A*-C pass rates have risen slightly from 56.1% in 2023 to 63.4% in 2025. C grades in particular have increased from 24.5% to 28.4% over the same period. E grades have declined marginally from 15.6% to 15.0%.

The subject shows relatively stable outcomes overall, with a slight shift towards mid-range grades.
–
Economics
Entries
Entries for Economics have stayed consistent, at 11,153 in 2023, 11,634 in 2024, and 11,278 in 2025.
Results
Results in Economics have been largely stable. A*-A grades have dipped slightly from 28.8% in 2023 to 27.0% in 2025.
A*-C pass rates have remained high, increasing from 78.4% in 2023 to 78.9% in 2025. B is the most common grade, rising from 28.8% to 31.5% over the same period. E grades have edged down from 5.6% to 5.2%.
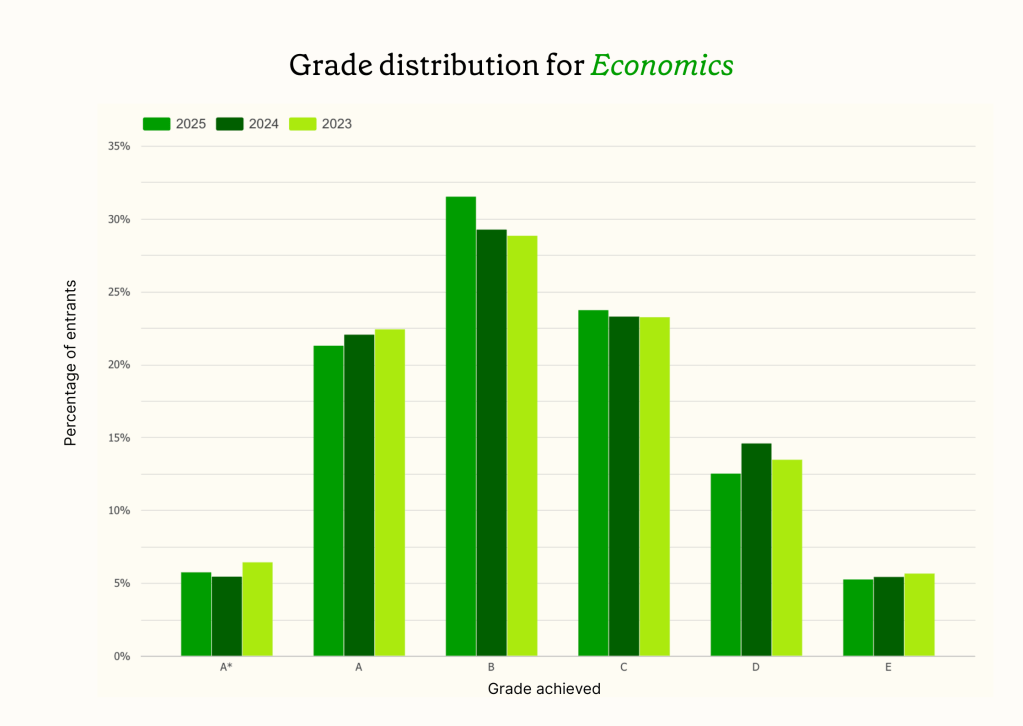
The subject shows stable outcomes overall, with a small shift towards B grades.
–
Business Management
Entries
Entries for Business Management have fluctuated, from 13,140 in 2023 to 13,596 in 2024, before falling to 12,573 in 2025.
Results
Results in Business Management have been stable overall. A*-A grades have risen slightly from 14.0% in 2023 to 15.1% in 2025.
A*-C pass rates have remained high at around 71–75%, reaching 74.3% in 2025. B is the most common grade, increasing from 30.2% in 2023 to 32.5% in 2025. E grades have dropped from 6.5% to 5.9%.
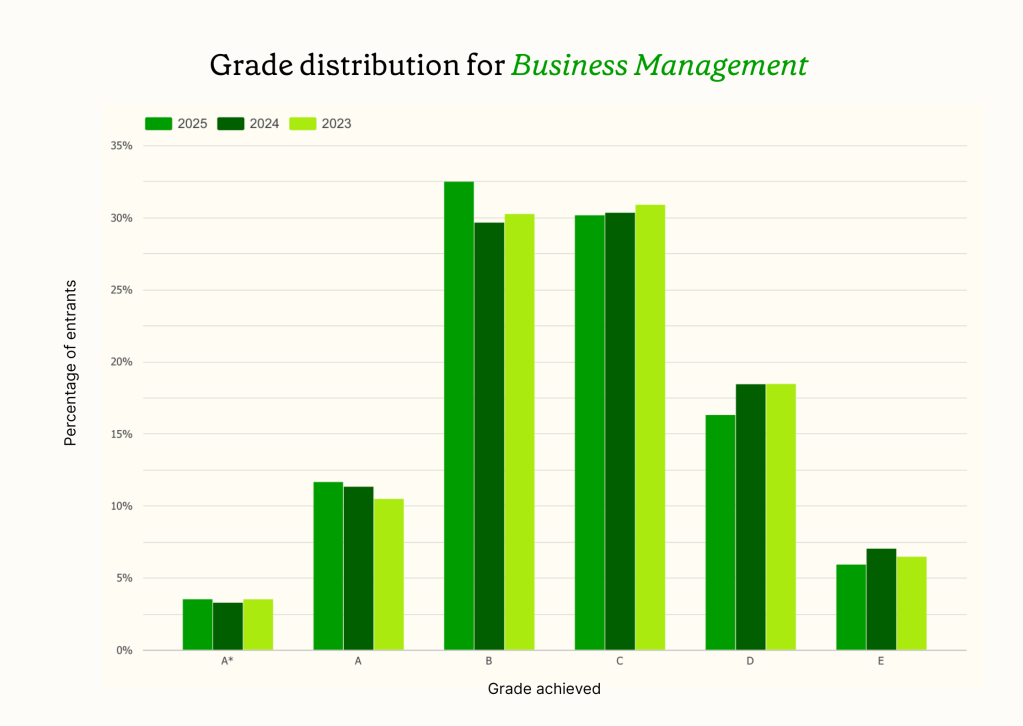
The subject shows stable outcomes overall, with a modest shift towards higher grades.
–
ICT
Entries
Entries for ICT have fluctuated, rising from 3,407 in 2023 to 3,729 in 2024, before falling to 3,319 in 2025.
Results
Results in ICT have been largely stable. A*-A grades have risen from 21.8% in 2023 to 24.6% in 2025.
A*-C pass rates have stayed strong, moving from 65.3% in 2023 to 71.2% in 2025. B is the most common grade, remaining at around 24%. E grades have declined from 12.0% to 10.4% over the period.
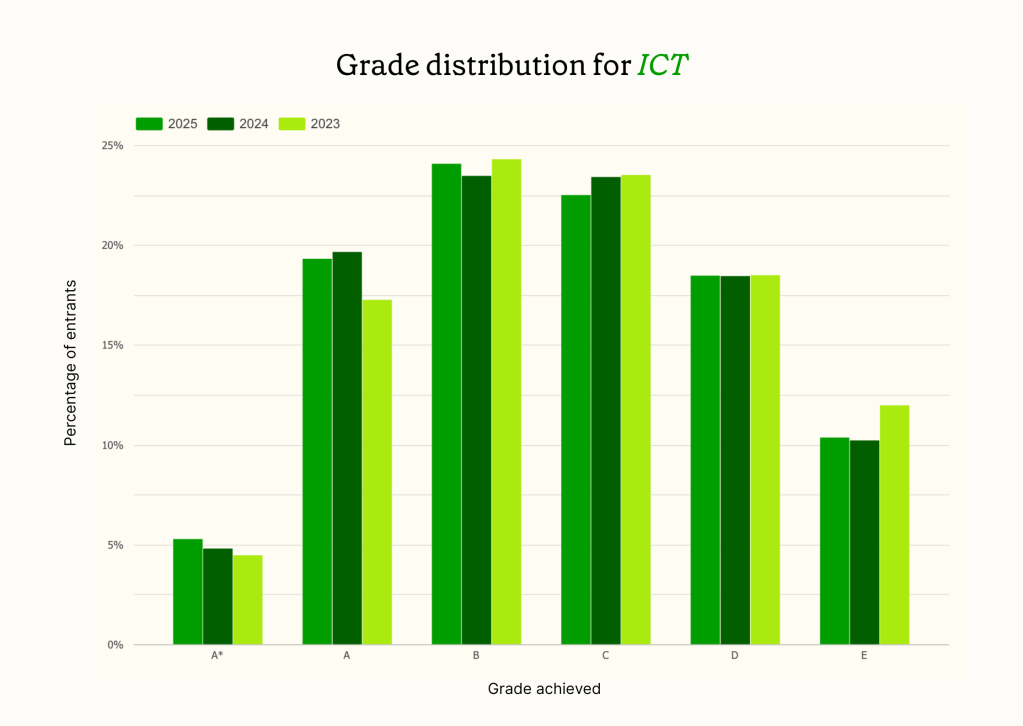
The subject shows stable outcomes overall, with a modest increase in the proportion of higher grades.
–
Manufacturing technologies
Entries
Entries for Manufacturing Technologies have decreased from 1,922 in 2023 to 1,960 in 2024, and down again to 1,749 in 2025.
Results
Results in Manufacturing Technologies have remained broadly stable. A*-A grades have risen from 13.7% in 2023 to 15.5% in 2025.
A*-C pass rates have moved from 66.3% in 2023 to 69.4% in 2025. B is the most common grade, sitting at around 24–25%. E grades have stayed close to 11% in 2023 and 2024, falling slightly to 10.6% in 2025.

The subject shows stable outcomes overall, with a small increase in the proportion of higher grades.
–
Media and communication
Entries
Entries for Media and Communication have remained consistent over the period, with 5,846 in 2023, 5,886 in 2024, and 5,817 in 2025.
Results
Results in Media and Communication have stayed steady. A*-A grades have moved from 12.3% in 2023 to 13.7% in 2025.
A*-C pass rates have remained high at around 77–78%, reaching 78.4% in 2025. B is the most common grade, increasing from 33.2% in 2023 to 34.1% in 2025. E grades have stayed low, between 3.8% and 4.6% over the three years.

The subject shows stable outcomes overall, with a slight shift towards higher grades.
–
Summary
Across over 200,000 A-Level results from Arbor schools, outcomes have remained broadly stable between 2023 and 2025. Many subjects show small improvements in A*-C pass rates and a gradual decline in lower grades, even where entries have fallen. STEM subjects in particular saw gains in higher grades, while creative and humanities subjects maintained strong pass rates despite declining participation in some areas. These patterns give schools a reliable benchmark to reflect on curriculum planning and student progress.
From everyone at Arbor, we’d like to extend our congratulations to all staff and students on the hard work that has gone into today’s results. Keep your eyes peeled for the next edition of The Data Drop, coming soon on GCSE Results Day!
Note:
To compile this data, we’ve taken average grades and entry counts across a number of exam boards and qualifications, and used the award’s “Discount Code” to group similar qualifications together for analysis. This analysis is based on results from English schools only.
In some cases, a result doesn’t have a grade — it’s still counted as an entry, but isn’t included in the grade analysis. ‘X’ and ‘U’ grades are not displayed on our charts.
In all cases, we’ve used A-Level data and not BTEC or other vocational data. This is an early snapshot of the data and may change. We plan to review this analysis in the near future. The analysis was correct at 16:00 on 13 August 2025.


